


It’s not easy to describe to a non-sailing audience why it has become so difficult to spot the wind from aboard a modern America’s Cup boat. Within seconds you get drawn into an explanation as to the differences between true and apparent wind speeds and angles, at which point you’re likely to have lost their focus and attention.
The easier way to get the point across is to ask them to imagine riding a motorcycle in full biker’s kit along a sea front at around 40 miles per hour when there’s a gentle onshore breeze blowing. Then, while travelling ask them to identify each gust as it rolls towards the shore and state; how long it will take before it gets there, the extra strength it will bring when it does and whether the wind direction will be different when it reaches them.
In addition, they will need to be pinpointing the number of gusts and puffs that are lurking further out to sea and state whether they are hanging out in a particular area. And all the while, they must continue riding the bike and be prepared to change direction by 90 degrees every now and then.
But most of all, they mustn’t get their calls wrong. One mistake and it’s over.
Spotting the wind has always been something of an art, but since the leading-edge machines climbed up onto foils to sail at three to four times the wind speed with 30-40 knots blasting over the deck and into their faces, getting a feel for the breeze has moved onto a different level and has left many of us behind.
With so much data streaming off a modern AC yacht and the ability to create sophisticated TV overlays, seeing the breeze and what it will mean for the racing has become the latest missing link.
According to Keith Williams, Chief Technology Officer and Executive Vice President at Capgemini Engineering, this was the starting point for Emirates Team New Zealand when they were considering how they could improve the TV broadcast for the 37th America’s Cup in Barcelona.
“When Capgemini began discussions with America's Cup about sponsorship and we wanted to bring some technology to it we asked what kind of problems they would like to solve. The one that Emirates Team New Zealand’s CEO Grant Dalton mentioned straight away was that he wanted to make the wind visible in the broadcast. So, when a boat went left or right, the commentators could much more easily explain why the skipper had made that particular decision,” he said.
‘Making the invisible visible’ became the unofficial strap line for a project that was to deliver a new level of insight for yacht racing with a continuous, live graphical overlay of the breeze distribution across the course. But unlike many of the sophisticated technical developments that spring up through the Cup, this one was for spectators only, the sailing teams would not have access.
“Let’s be clear, this had never been done before,” continued Williams. “Emirates Team New Zealand had carried out some initial work with University of Canterbury in New Zealand to look at theoretically whether it was possible and they handed us the initial work, but that was all, we started the project from there.”
When the final project, Windsight IQ was unveiled at the beginning of the Challenger selection series in August there were two popular comments among the pundits. The first was to ask how this real time display had been achieved. The second brought into question whether the system would be so accurate that it would show up weaknesses within various teams by revealing how often and how badly they were getting the breeze calls wrong.
The answer to the first question was the easier one to answer, at least initially.
The system is based on Light Detection and Ranging – LiDAR as it is better known.
“Essentially LiDAR works by transmitting a beam of light that reflects back off something and from that you can deduce things like distance or speed. What's special about the light source that we're using for the Cup is the range, between 6 and 12km. Each of our LiDARs are 100kg units so they are significant pieces of equipment. Normally they would be used for applications like wind turbine planning where you would place devices in an area and then let them run for a number of months to collect all the data. From that you'd be able to optimise the orientation of the of the wind turbines.”
Measuring the wind involves bouncing the LiDAR beams off air borne particles and impurities like dust and a pollution. The reflection is sensed, monitored and then measured to calculate the speed and direction of the wind.
But it’s not quite that simple.
“Each the LIDARs that we that we use emits 10,000 beams per second. Over the Barcelona Bay area we had one LiDAR on top of a water reprocessing plant, a second one next to the W Hotel and a third one at the port at the port of Barcelona.
“Logistically it was quite challenging getting a 100kg unit on top of these buildings and getting power and telecommunications to them. Each unit had to be in exactly the right place in order to be able to scan all directions
“Once they had been set at the beginning of the day we spent a lot of time configuring the LiDAR, checking the conditions and then making sure the data from each of the units was fused together correctly. This was a key stage as it combinied the wind data that allows us to create the wind field that we can feed into the broadcast system once a second.”
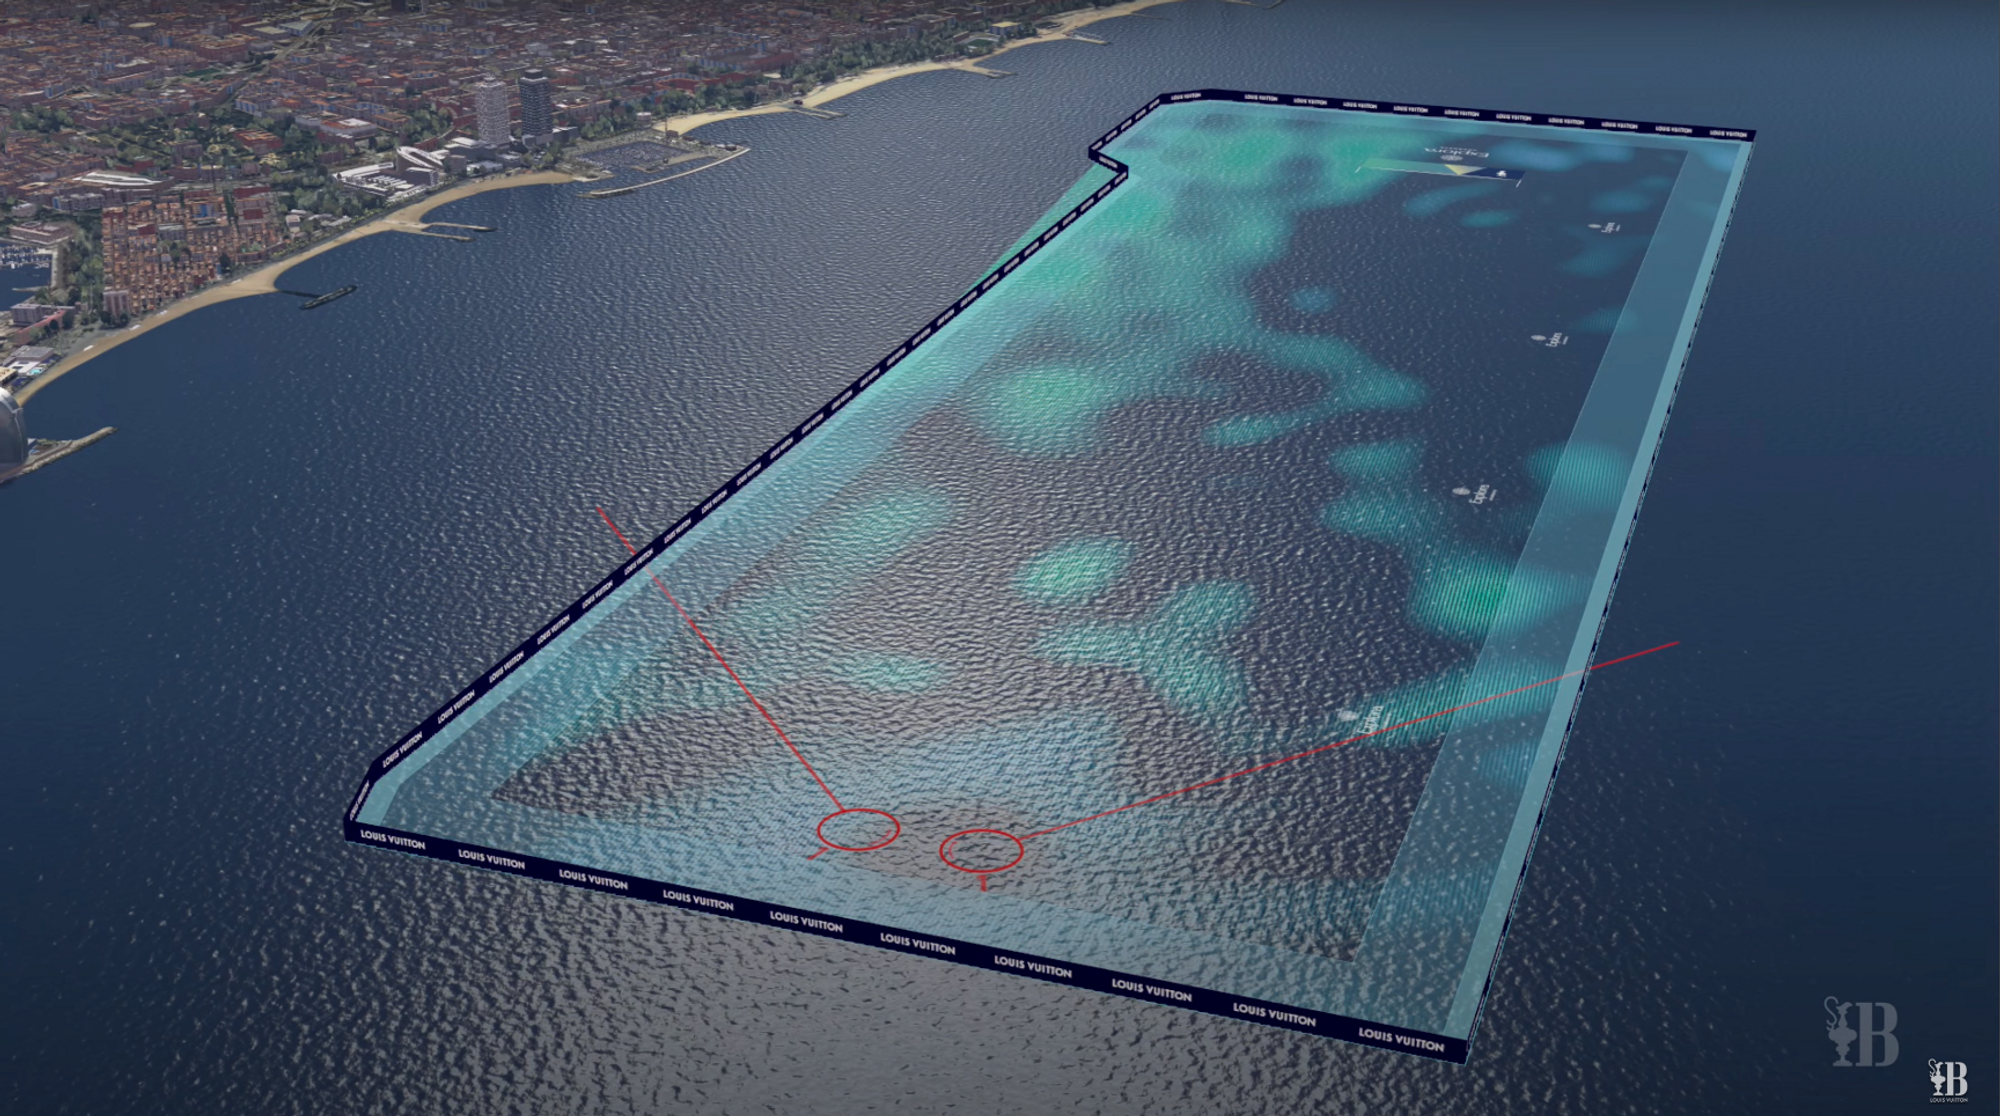
To create the full map the system divided the race area up into ten metre squared sections of air, which received at least one LiDAR beam every 15 seconds. From here a combination of measurements and predictions lies at the heart of creating the map.
“The racecourse was divided into it's just under a quarter of a million cells and for each of those cells we either did a forecast of what the wind was going to do in that individual cell, or we received a measurement. This meant that each of those quarter of a million cells was constantly being updated with predictions and measurements, so where a LiDAR was not received, there was a prediction step made using a Kalman filter. This is a well-established engineering tool where you have a physics model of a phenomenon, in our case the wind. The physics model is then updated with real time measurements from the real world as we receive them and feed them in.”
The ability to compare predictions and measurements was crucial as the LiDAR response varies depending on atmospheric conditions including the composition of the air and as Williams went on to explain, tuning the LiDAR to conditions is a big part of the skill.
“If it rains the impurities in the air get washed out which means we can face a drop off in performance. If this happens it takes a while for the atmosphere to recover and the particles to return. So, during the racing we’re in constant communication with the rest of our team so that we can ensure that we have a valid wind field.”
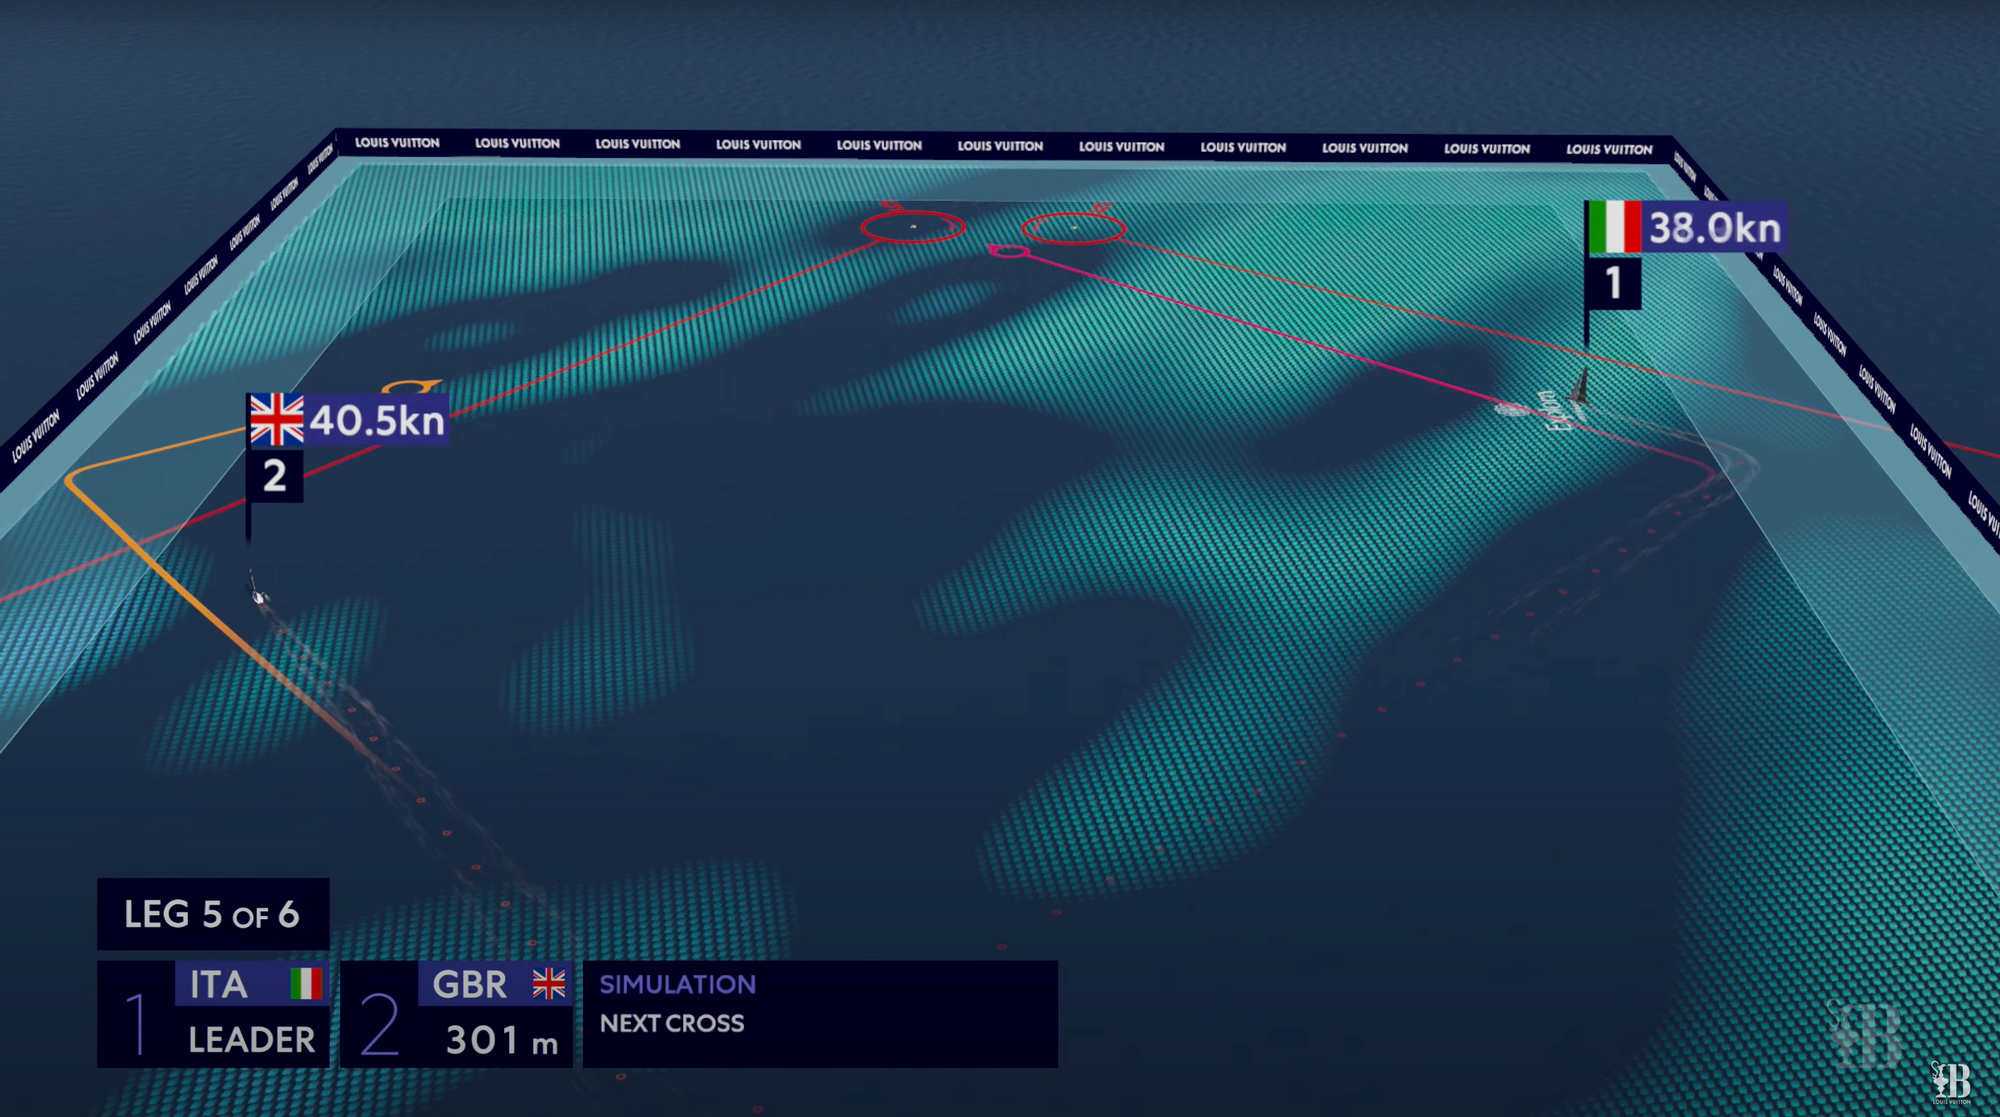
Given the degree of accuracy that was being achieved the next level for the broadcast presentation was to introduce the polar performance profiles for the boats into the wind field to establish track predictions.
“We were able to do this thanks to the accuracy of performance data that was available which in turn allowed us to use a ghost boat to map out details such as the best side of the line to start, where the first cross would be and other tactical information.”
All of which is a significant step forward. And yet according to Williams, one of the most complex areas to resolve was how best to create an effective way of presenting the information in an understandable format for viewers.
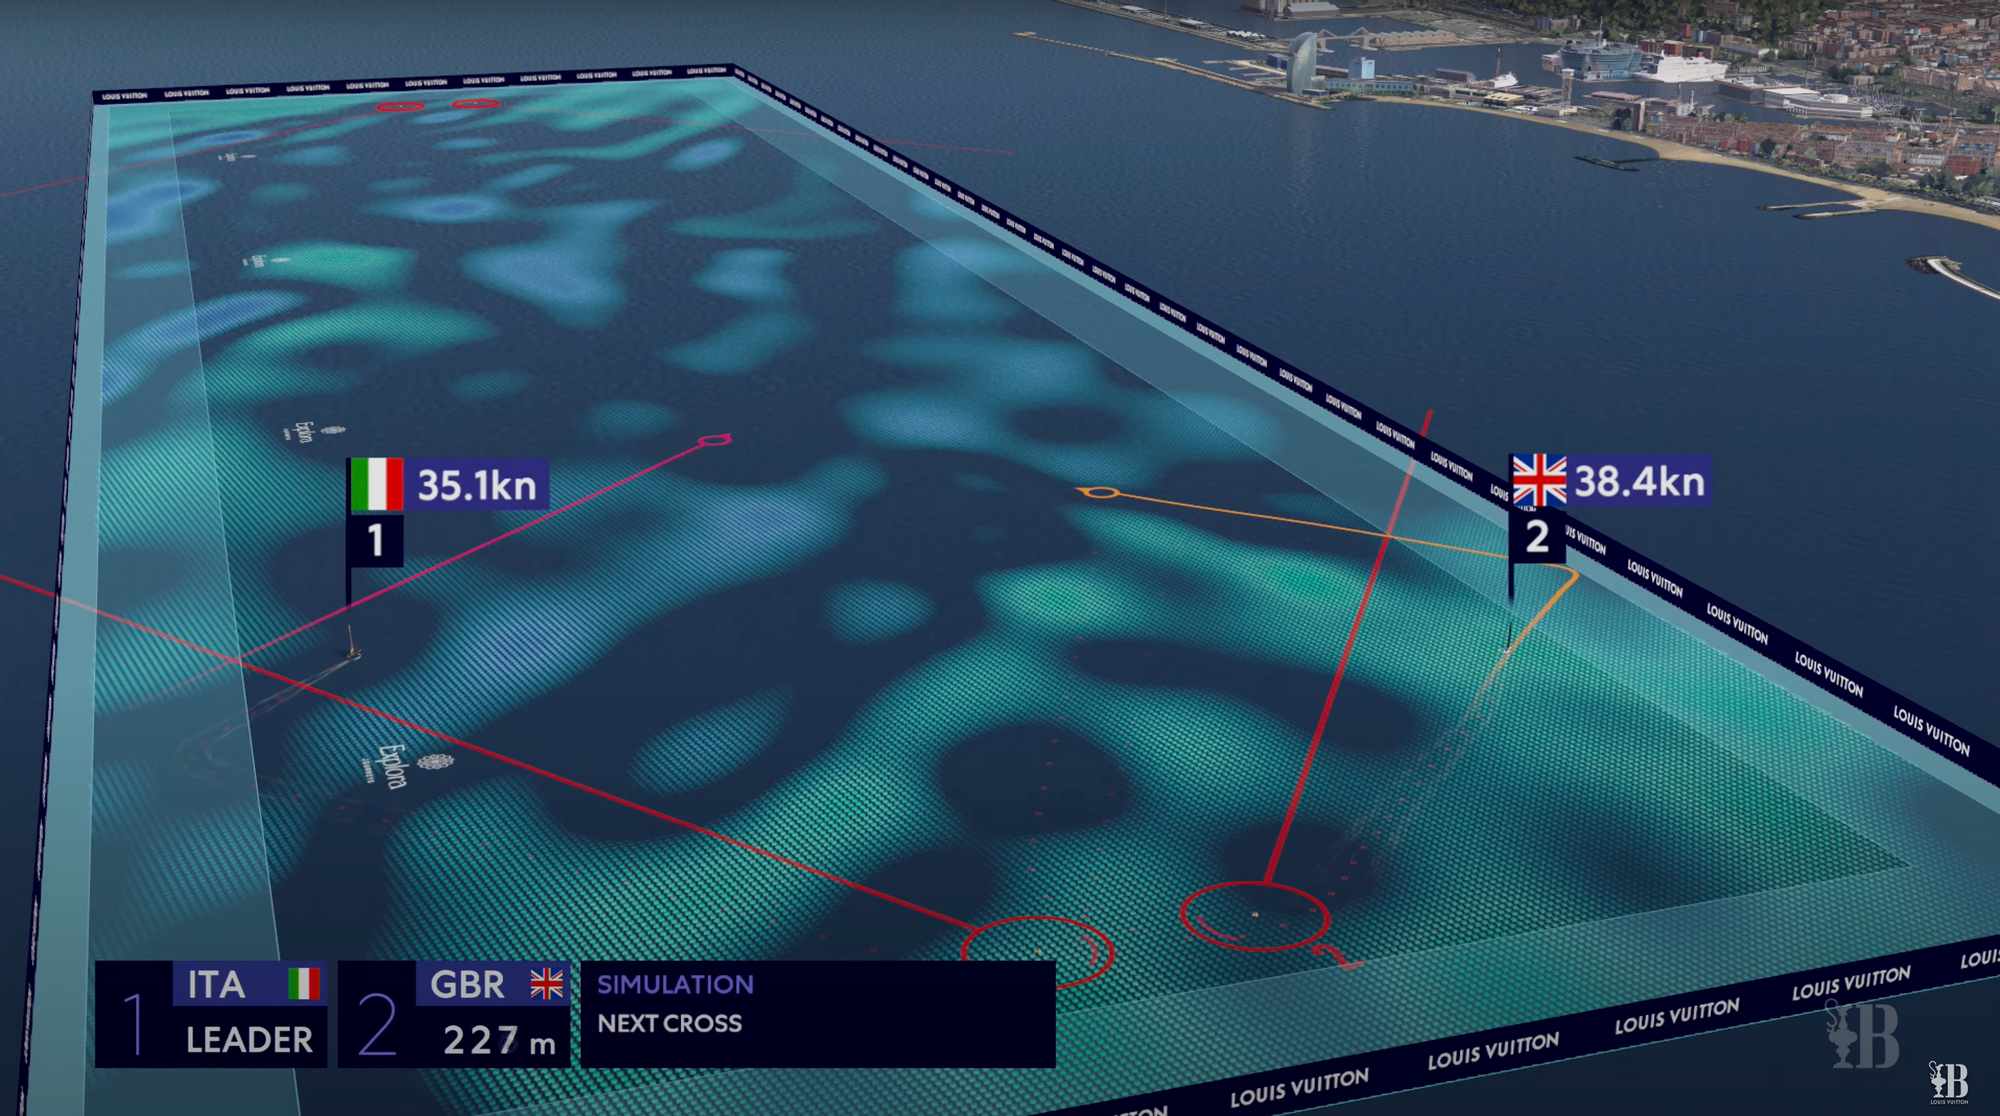
Their solution was to represent the average wind speed with the colour of the sea, blue. Any readings that were higher would be green through to yellow depending on the strength and where the wind goes lighter the surface would be dark blue.
The result was both extremely easy to interpret without cluttering the story of the race, but also very revealing as each gust, lull and shift laid itself over the course.
But perhaps the biggest surprise of all was that rather than causing potential embarrassment to teams by highlighting any shortcomings in their ability to read the conditions accurately, the reverse was frequently true.
Whether they were leading or trailing rarely mattered, their ability to anticipate small fluctuations in the conditions highlighted their expertise rather than the other way around.
Those of us watching may have been armchair experts for the 37th America’s Cup, but the true talent was still on the water, it had just taken technology and a motorcycle analogy to show us.
Sign up for a Free Membership or for full access try a Paid Membership free 30-day trial.
No obligation. Cancel anytime.
FREE TRIAL


